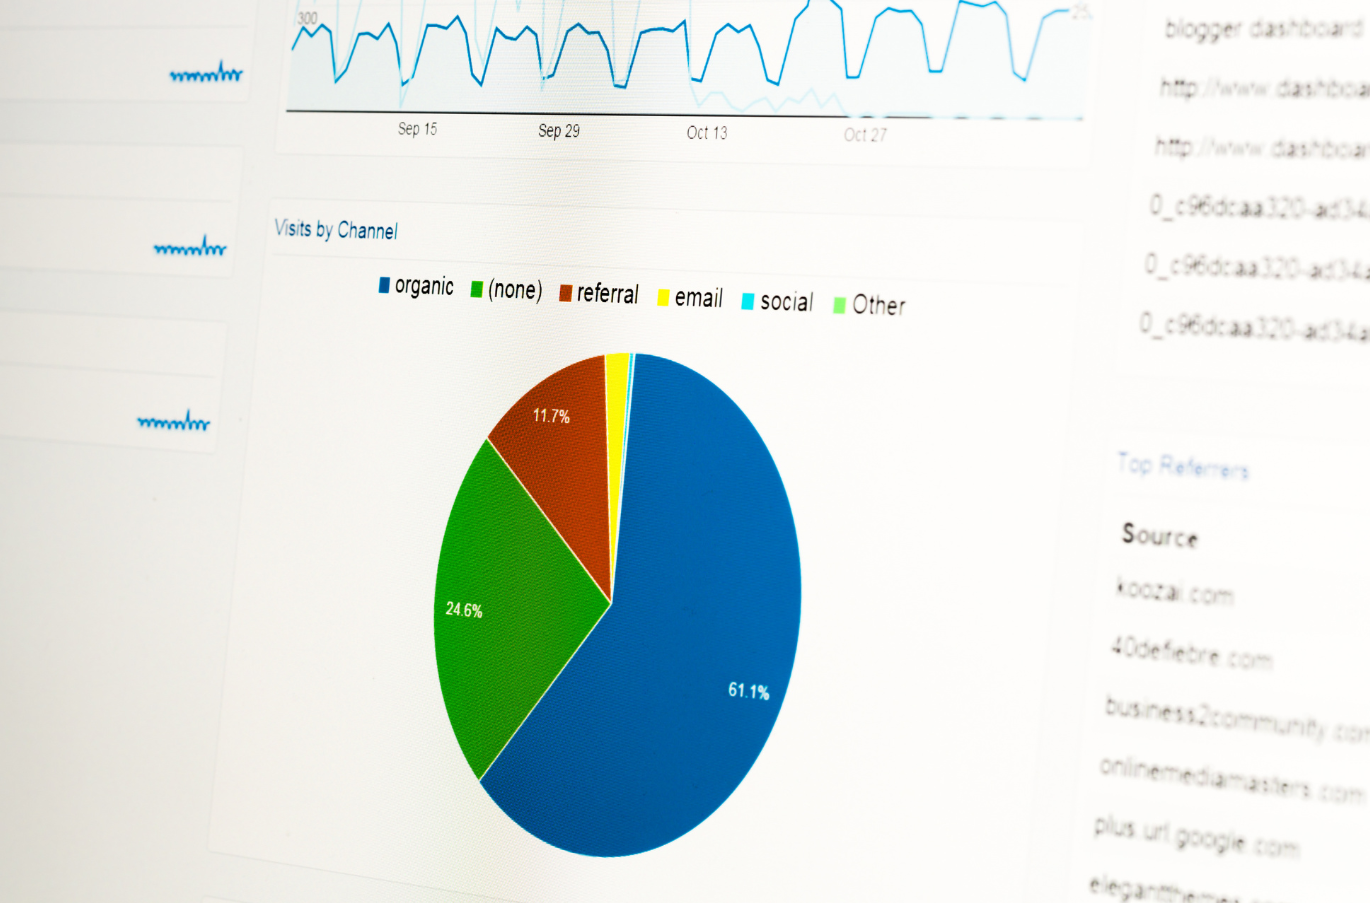
The system contains a fully-fledged dashboard on web and android application so the user can check project status, details and the location area of the project. Whereas any user can access the dashboard viewing all the organizational detail including statistical graphs/charts. Charts and graphs includes the details of functional/non-functional tube wells, HR details in designation wise and location wise shows the number of employees on graph. Automated system makes the coordination better for effective decision making. It enables all the line departments to work more smart & efficient, saving their time & resources.
Features
• Location of the tube wells in city or specific area.
• Projects status.
• Filtration plants points location.
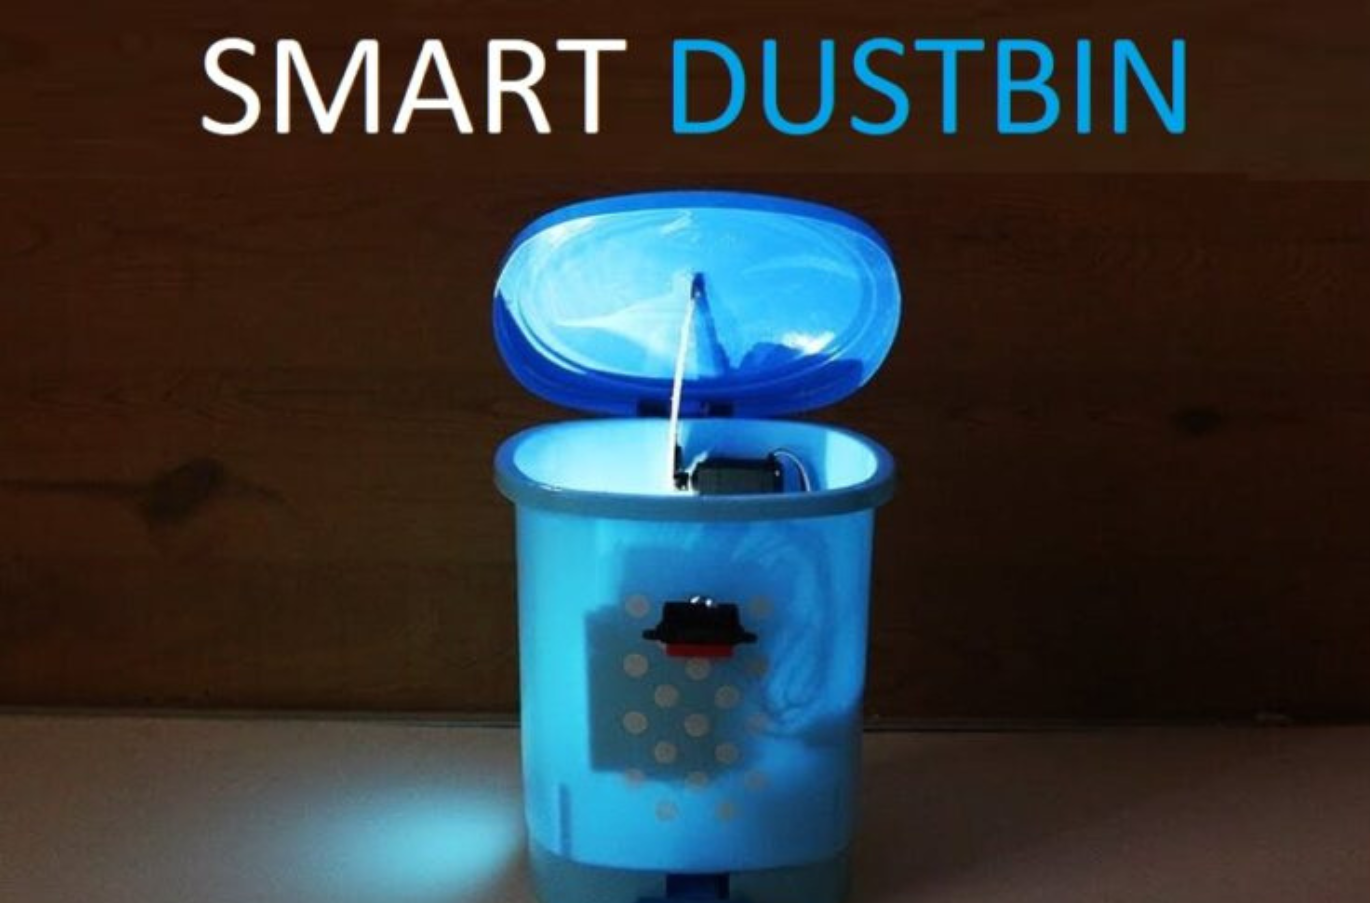
• MCQ garbage container points location.
• Tube wells details with location address and function/non-functional status.
• Garbage container location its address and status whether its container or non-container (open) point.
• HR details of the employees currently working where and which position